In this article, we will explain how to monitor your Shared Hosting resources.
Follow these steps to monitor your shared hosting resources:
- Log into your “cPanel Account”.
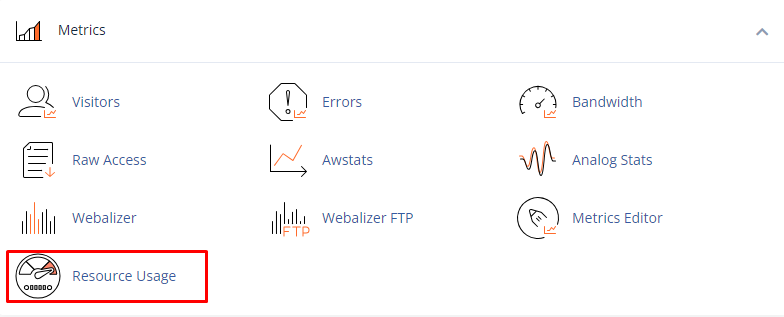
- From the “Metrics” section, click on the “Resource Usage” option.
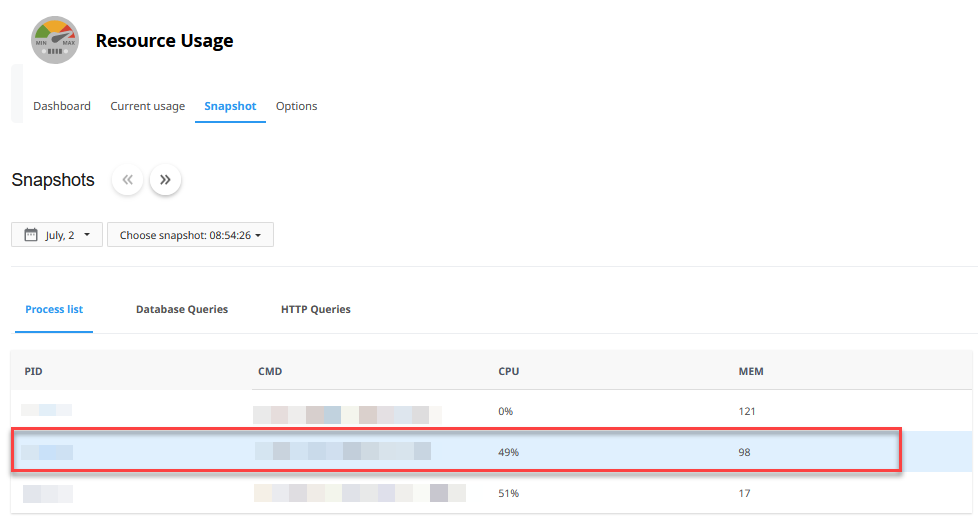
- Click the “Snapshot tab” to view resource usage snapshots. It will show depending on your account’s resource usage, It will display a list of processes and a list of database queries:
- To view the snapshots in sequence, use the arrow buttons.
- To select a specific date to view, use the calendar list box.
- To view specific times, use the snapshot list box.
- PID: This is the process ID.
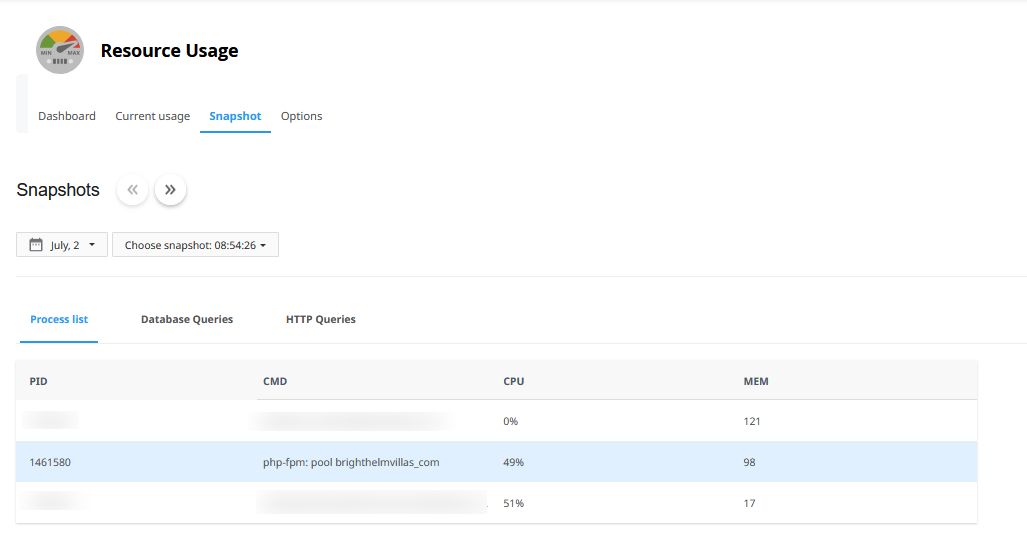
- CMD: This is the actual command that the process ran.
- CPU: This is the CPU usage of the process. In this case, pool the XXX exceeded CPU capacity twice (49% and 50%).
- MEM: This is the amount of memory used by the process, in megabytes.
In this way, you can monitor your Shared Hosting resources. For more information on shared hosting, visit our knowledge base section.

Related Articles
Error: Permission denied: .htaccess pcfg_openfile: unable to check htaccess file, ensure it is reada...May 8, 2024
How to eliminate a WHM reseller without an associated domainApril 29, 2024
How to alter ownership of multiple accounts in WHMApril 24, 2024
How to manage external authentications in WHMMarch 8, 2024